Viawind: 3D viewer to show the real impact of an offshore wind farm
We are facing the greatest environmental challenge in history, and the transition to a process of decarbonization and reduction of carbon emissions is essential to maintain the quality of life of the world’s population.
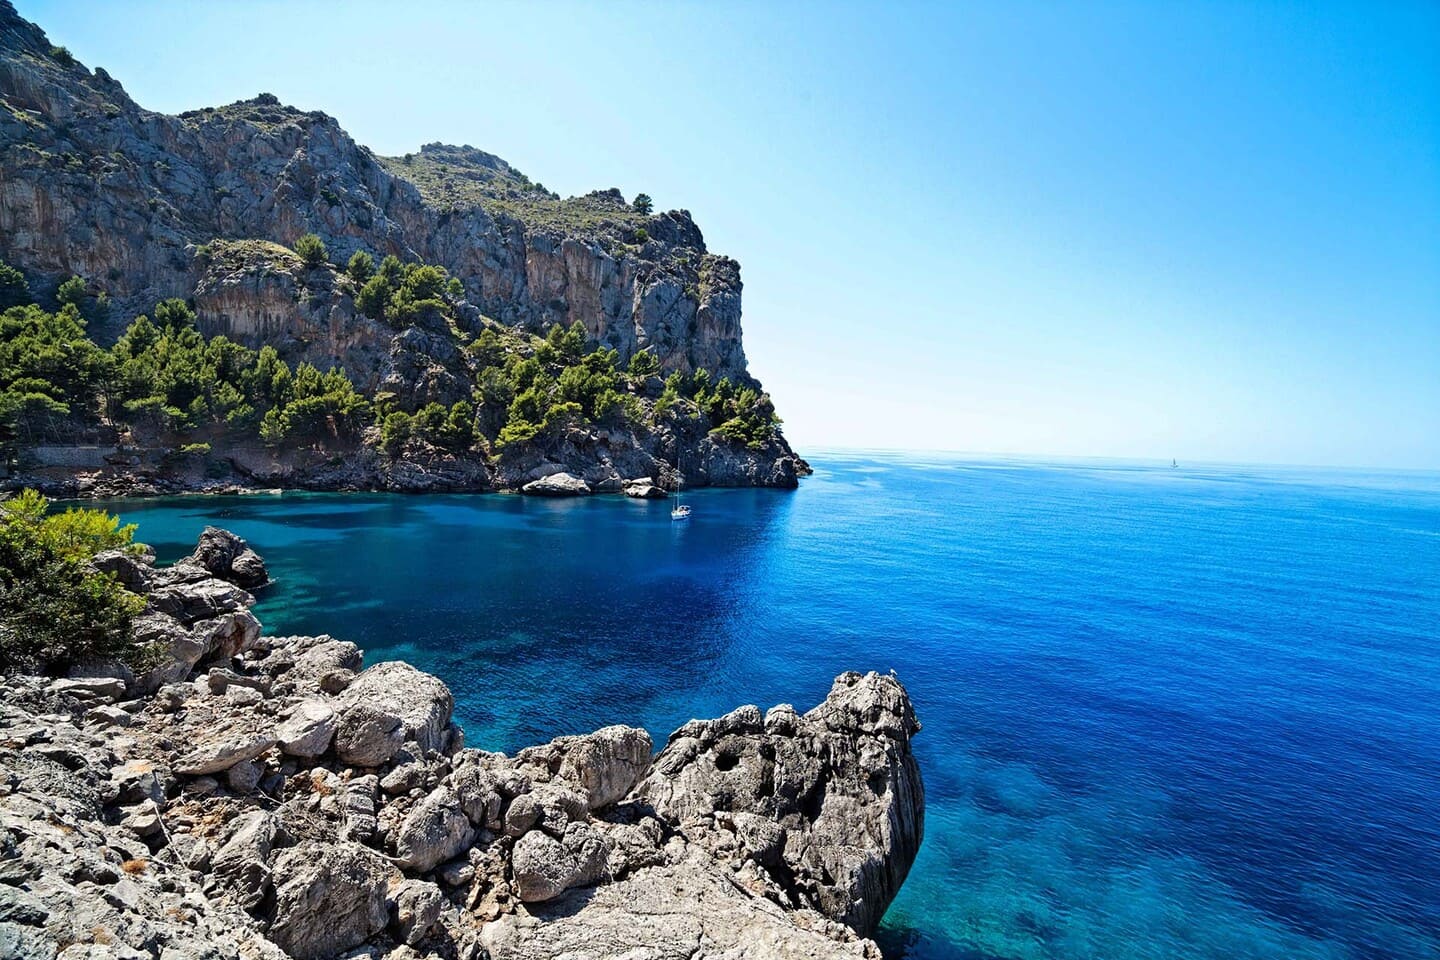
Renewable energies such as offshore wind are one of the keys to combating climate change, but their visual impact can jeopardize the viability of a project.
How to show in a realistic way the final result? A 3D viewer can help me to get the concession of such a project? How to help the environment?
Viawind was created to answer all these questions. It is a 3D viewer created from real photographs and supported by mathematical calculations, which anticipates the 3D landscape study by creating ultra-realistic Asset Digital Twin simulations of the wind turbines of the offshore wind farm.
BlueFloat Energy is a reference in the development of offshore wind energy projects worldwide and is redefining the sector.
Energy demand is growing beyond current generation, and the world’s population is expected to increase to 9.7 billion by 2050. Therefore, the strategic plans of many countries and their sustainable development are supported by renewable energy policies such as offshore wind.
However, when it comes to installing these farms, the visual impact on the ecosystem in which they are to be built must be taken into account. Technology had to provide this answer, and using a 3D viewer that provided a 100% realistic visualization of this impact would be the key to moving forward with the project or not.
The process
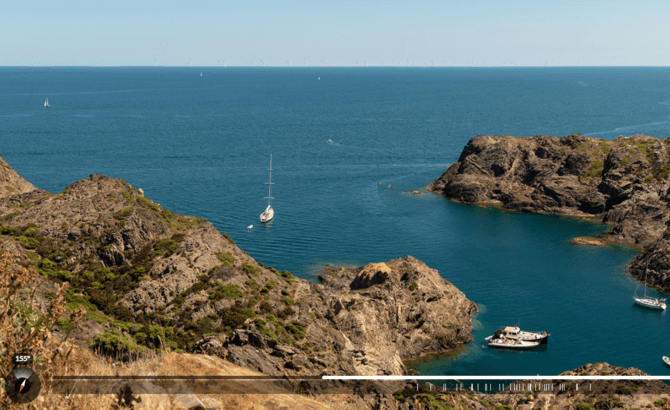
To meet the challenge, we developed a 3D simulator, based on our Evergine graphics engine, which takes into account variables such as the rotation of the earth or the key points of the coast to make the visualization realistic and objective.
The viewer evaluates 3 crucial points: position, measurement and distance. To obtain the position, we combine two recognizable landmarks on a map and, applying trigonometry, we obtain the exact position angle of their GPS coordinates.
Development of the viewer with Evergine graphic engine.
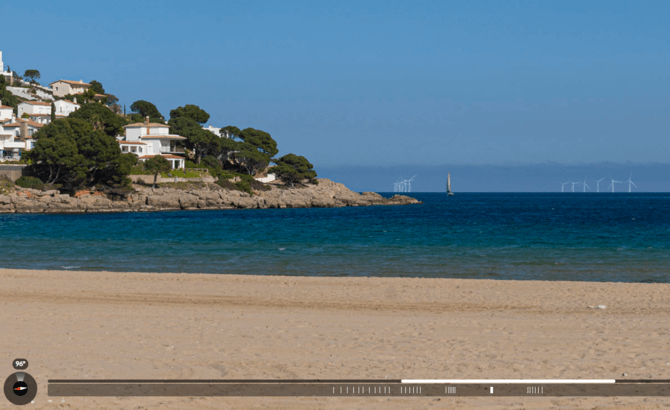
In addition, the results are posted on a website where you can view the simulation from various points and times of the day, as well as key information about the park.
We also calculate the measurement of the generators and obtain the angular. Finally, we take into account their height and distance to the horizon and the hidden area to obtain the distance.
3D simulation to show the visual impact on offshore wind farms.
Results
- Eliminates inaccuracies and approximations.
- Reduces the time needed to inform stakeholders and find common ground.
- Ensures compliance with local legislation.
- Improves project approval rate and permitting times.
- Simulates daytime and nighttime effects.
- Provides key information on images and turbines.
We are ready for new challenges