
Elena Canorea
Communications Lead
Introduction
Collecting large amounts of data is useless if it is not analyzed and represented. One of the main virtues of Big Data is that the related technology (artificial intelligence, machine learning…) is able to offer analysis in a time and accuracy incomparable to that of a human. And not only that: the technology also provides analysis in a visual form to make decision-making easier. All this is offered by tools such as Power BI, for example.
What is Power BI?
Power BI is a Microsoft tool with Artificial Intelligence that creates interactive data visualizations in a short time for companies and across dashboards. The tool has hundreds of visual objects (graphs, maps, trees…) to offer the best and most attractive representation. Once Power BI connects to local or cloud data sources, users operate on them to make them more visual. Reports can be worked on in teams and in Microsoft Office suite applications such as Excel or Teams. In addition, it is also possible to work from a mobile application, and therefore connect to data sources from anywhere, or integrate them via an API. It has a notification and alert service for new data. On the other hand, it can be connected to Azure Synapse Analytics to improve the experience of centralization and data analysis in the cloud and link it with business applications (Power Apps). 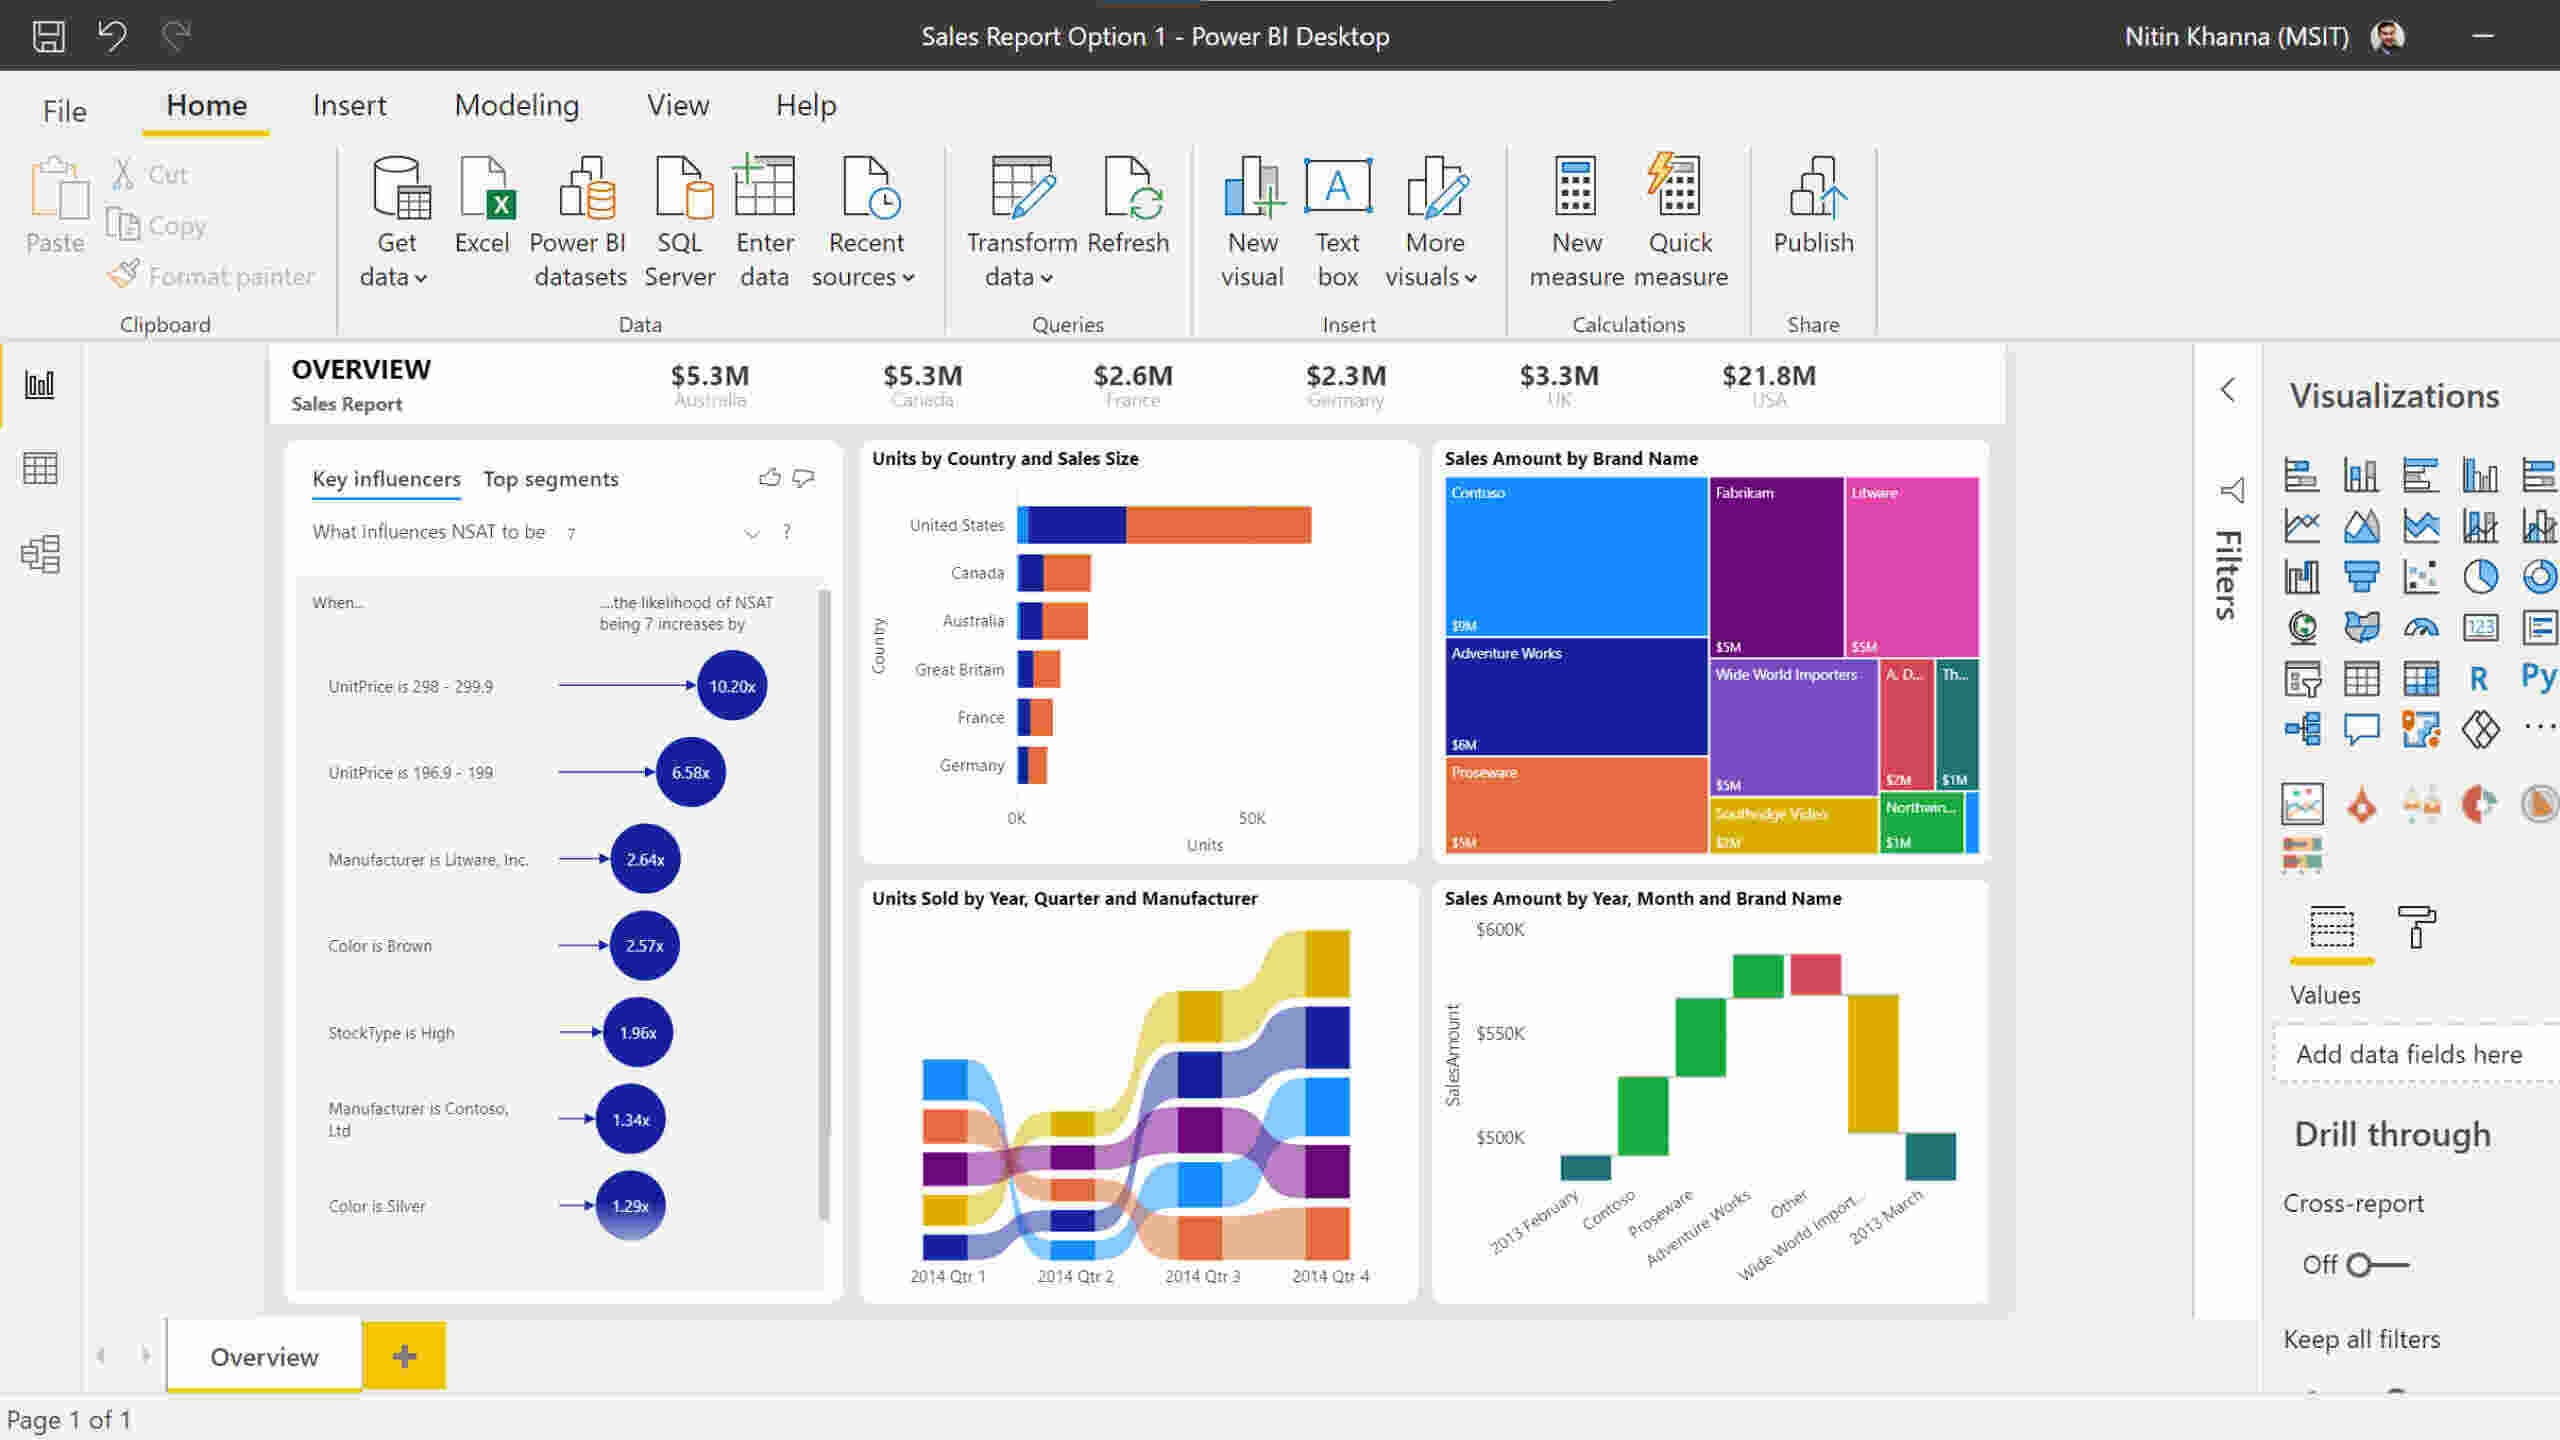
Power BI applications are packaged content that is collaboratively created for delivery between members of the organization. In this app, there can be reports, spreadsheets, dashboards… When an update is published, the end user receives a notification in order to see the new information instantly.
What is Power BI used for?
By showing the audience the analysis with visual elements, the information is easier to understand and more attractive. Therefore, it is also easier to be inspired or to make decisions. https://www.youtube.com/watch?v=yKTSLffVGbk Power BI cuenta con inteligencia artificial de Microsoft y tecnología de machine learning que ayudan a dar con el mejor enfoque para desplegar un dashboard o un informe muy visual. Una muestra del éxito de este programa es que Microsoft recibió en marzo de 2022 la calificación de «líder» en el Magic Quadrant™ for Analytics and Business Intelligence Platform. Según un estudio de Forrester Consulting en el que 63 compañías afirmaron que obtenían mejores analíticas desde que usaban Power BI, es posible un ROI del 366% en hasta tres años usando esta plataforma. Así han usado Power BI empresas de muy diversos sectores:
What is DAX in Power BI
DAX en Power BI es, según la propia Microsoft, una «colección de funciones, operadores y constantes» para obtener información a través de datos. Las fórmulas DAX pueden, por ejemplo, calcular porcentajes de crecimiento y, a partir de ahí, tomar decisiones sobre el futuro de productos. Es, en definitiva, una muy buena herramienta para hacer comparaciones. Estas fórmulas son propias de Power BI Desktop, la aplicación de Power Bi para escritorio, y recuerdan a las de Excel, por lo que haber usado las hojas de cálculo de Microsoft ayuda a manejar DAX. 
Related to DAX, measures, in Microsoft’s words, are dynamic calculation formulas in Power BI: as the context varies, the results vary. They are used in reports where data is joined and filtered, for example, in Excel pivot tables and charts. In this way, data is reviewed instantly and independently of constant changes within it. To create Power BI measures, use the DAX formula library, which includes more than 200 functions, constructs, and operators.
Power BI Pro
Power BI Pro is a license with which a user can view reports and dashboards of other users in Power BI. In addition, if these users are Power BI Pro, they can collaborate with them on their creations. User licenses are purchased in the Microsoft 365 Admin Center, through the Global Administrator or Billing Administrator roles. The evolution of Power BI Pro is Power BI Premium, which uses advanced AI to manage data. It is possible to add automatic scalability for unforeseen increases in usage. 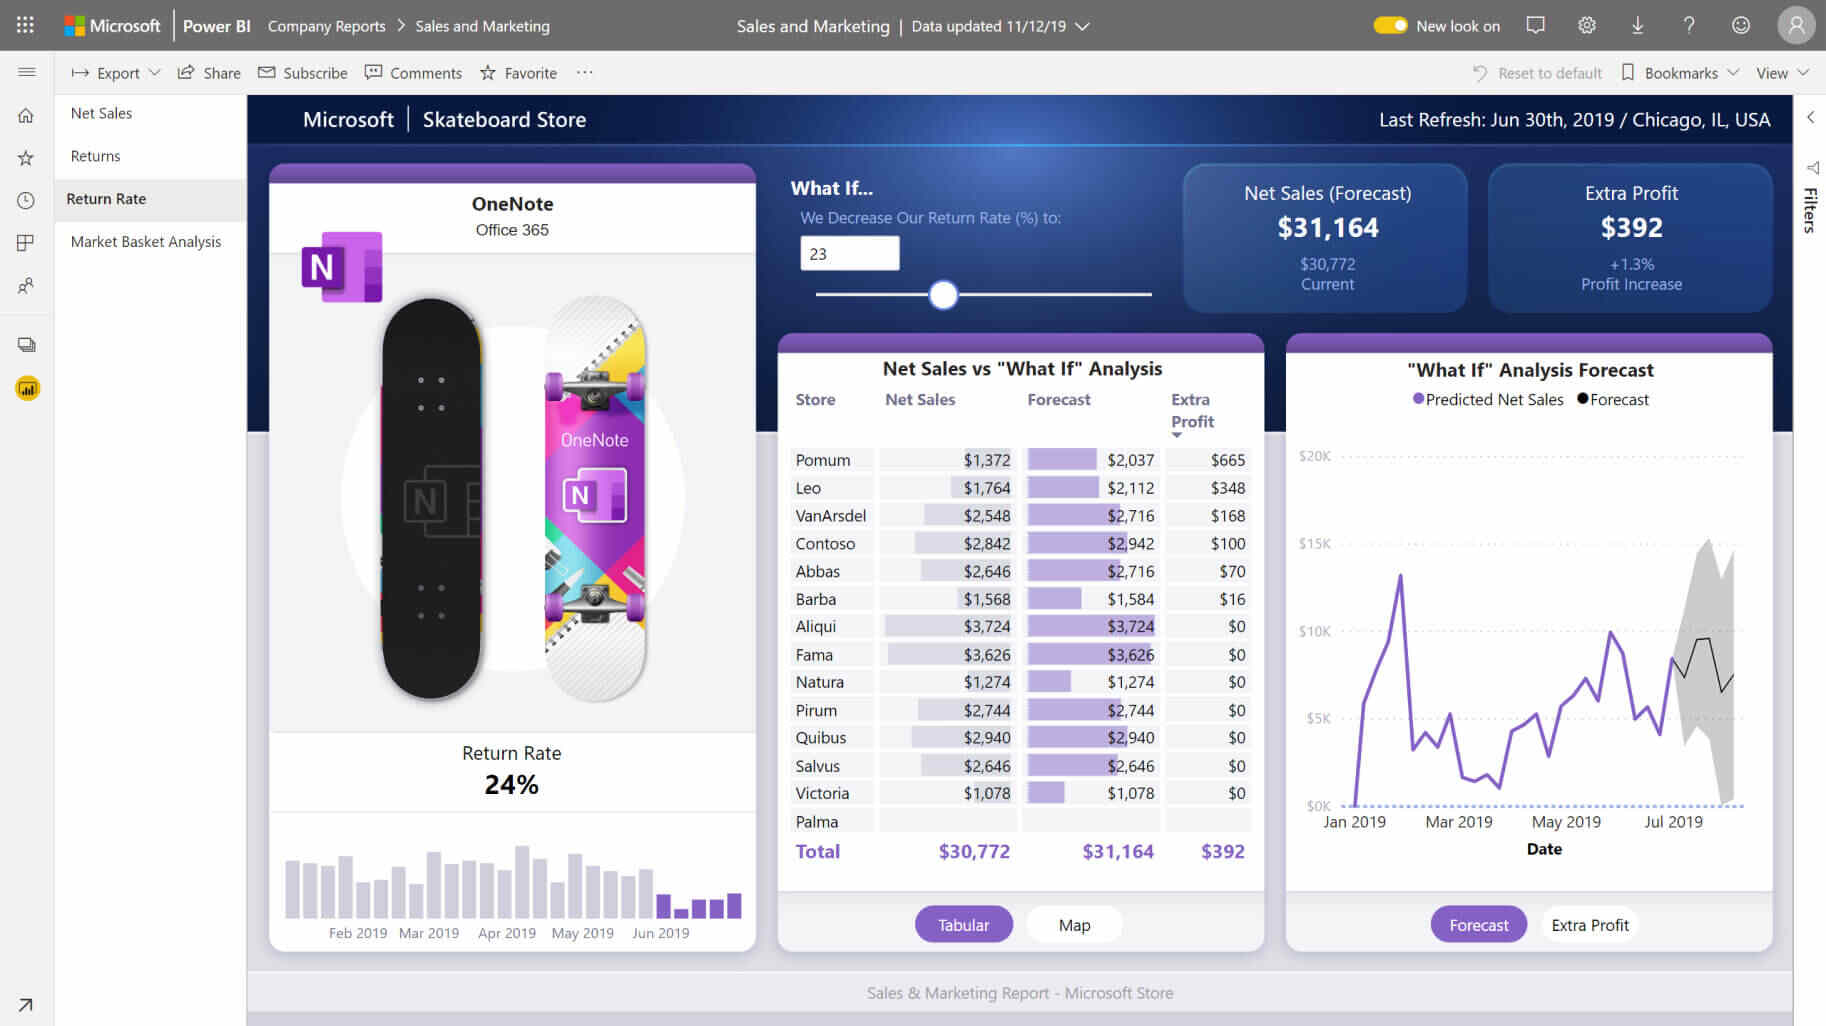
Why use Power BI in your company?
Power BI is a powerful tool for making better business decisions in a more attractive and agile way than with other technologies. The latter is aided by access to information in real-time and from desktop or mobile devices, and the ability to customize dashboards. In addition, Power BI not only integrates with other Microsoft products such as the Office suite (we have already seen how interesting it is to integrate it with Excel) but also with other external tools such as Google Analytics. Thanks to these connections and the creativity of the employees, in just a few minutes it is possible to create a highly customized report on some aspect of the company and act accordingly. All at a lower cost in terms of time and money than would be necessary if the work were done manually. Power BI can also be used to control internal company processes. Thus, it is possible to create a dashboard with which to analyze the day-to-day running of the company and make decisions that lead to new directions; for example, analyzing the working hours of each employee, in order to know if it is necessary to hire more staff to distribute the tasks. If you want to know more about it, in this Plain Concepts virtual coffee we explain how to create a scorecard and we transfer it to a practical case: analyzing clocking, punctuality, and working hours.
How Plain Concepts helps you leverage the full potential of Power BI
At Plain Concepts, we specialize in helping you get the most out of the data you gather. That’s why we develop Power BI utilities for you and explain how to get the benefit of this tool at a lower cost than others. Will you join us? 
Elena Canorea
Communications Lead
