
Elena Canorea
Communications Lead
Open Data is an initiative of Public Administrations to make certain data and information accessible and available to everyone. The intention of this practice is to allow its use by companies and citizens to achieve results. However, accessing and analyzing them correctly can be complicated.
In this article we are going to address the simplest factors and the analysis of these data sources, using as an example the system that sets the price of electricity and how this open data end up influencing our bills.
The electricity market in Spain is composed of 4 main agents: generators (companies that generate electricity), transmission (transmit high voltage electricity to distributors), distributors (distribute low and medium voltage electricity to consumers), and traders (market electricity, mainly focused on the residential sector).
These 4 agents share the pie represented in the electricity bill that reaches the consumer. While the costs of transport and distribution can be considered fixed, it is the costs of generators and consumers that are responsible for the volatility of the price of electricity. Consumers with a free tariff (60% of consumers have this tariff according to CNMC) are more protected against price volatility, but normally consumers with a regulated tariff (PVPC – voluntary price for small consumers) get better conditions as they pay electricity at the market price.
As mentioned above, the regulated rate is strongly influenced by the real market price, which can be represented using a classic supply and demand curve. This curve shows the relationship between the quantity demanded and the price offered in the market. The price of electricity results from the equilibrium (intersection, matching) of both components (demand and supply).
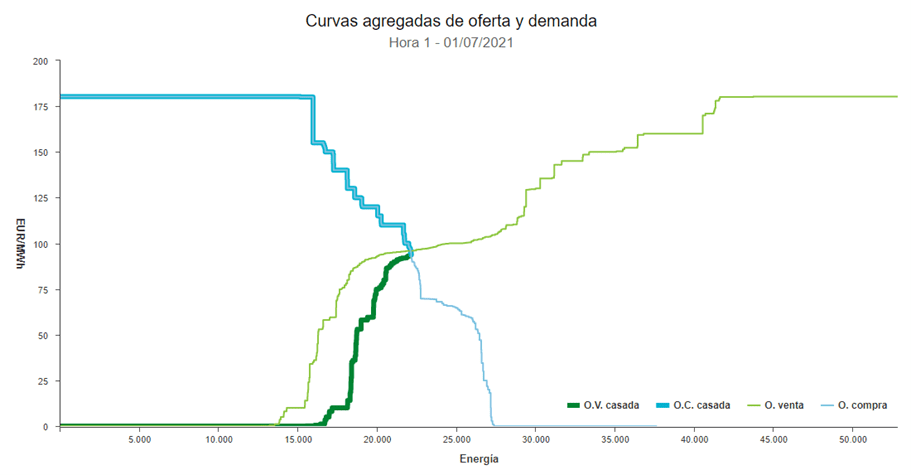
The day before the actual consumption of electricity, the matching between supply and demand is performed, based on the forecasts sent by the system agents (mainly generators and distributors). The matching begins by ordering the offers of the generating agents from lowest to highest price (the cheapest offers usually correspond to nuclear energy, followed by renewables, combined cycle, hydro and coal, approximately), and then calculates the last offer with which the estimated consumer demand is guaranteed. The price of this last bid is the marginal price paid to all generating agents (whether or not their share of energy is consumed, or their production cost is higher or lower). This type of auction is called marginalist.
A first approach for the analysis and prediction of the price of electricity would be to decompose the problem in the study of these two curves, and the factors that can influence each component.
The factors involved in both the supply and demand curves can be diverse and suffer from complex interrelationships. But to limit the scope of this article, we will restrict ourselves to the study of the simplest factors.
The amount consumed can easily depend on meteorological factors (for example, the hotter it is, the greater the energy required to cover the needs of air conditioners and air conditioners). In Spain, there is a lot of activity dedicated to tourism, so it would also be easy to think that the tertiary sector can cause an increase in energy due to increased business activity. Finally, we can also understand that demand may be influenced by the working calendar itself (for example, industrial activity may be lower on weekends and holidays).
On the other hand, among the factors that can affect energy supply, we again have weather factors, which can greatly affect the production of renewable energies (mainly, we have solar, wind, and geothermal energy). In some cases, we must also take into account the cost of the raw material (e.g. the price of gas), its interrelations with other raw materials in national/international markets (e.g. the cost of a barrel of Brent), and the costs derived from its consumption (e.g. CO2 emission rights). To some extent, we could also look at other more speculative factors (e.g. using the share price of the companies involved in the system).
In the case of Business Intelligence or Machine Learning solutions, the data becomes the main component of the system. Therefore, we must pay special attention to everything related to the data, especially if this data comes from the integration with third-party systems. From this point of view, there are several factors when analyzing these data sources:

Data sources have different operating costs. Thus, the integration of public and free sources is usually much simpler and faster, although the quality and quantity of data may be higher when using private data sources. Regarding the type of information, it is much more complex to process data stored in images (jpeg, PDF), text (Word files), or web pages that require complex collection processes (web scrapping).
For these reasons, it is preferable to obtain data in formats that are easily processed programmatically, such as tabular formats (using CSV, parquet, or even Excel files). Also, initially accessing an offline source may be easier, but many times we will need to continuously update the information, for which online systems are more versatile.
In the following, we will look at some of the data sources that we can use to analyze supply and demand curves. This selection represents a sample of the different scenarios we may encounter when managing and processing data from external sources.
The price of electricity is the main data of our study. This data is available from the OMIE (Iberian Energy Market Operator) website, where you can see the price of the energy for the current day, hourly. As we have explained above, the auction for the current day takes place the day before, so it is already possible to know the price of energy at any time of the day.
But to develop our solution, we not only need data as of today, but we also need to collect historical data. How far back in time do we need to go? The answer to this question most of the time is “it depends on the case”, probably followed by “but all the data available is a good start”.
In our case, the historical data is available at OMIE’s own website, so downloading them can be automated, using a website scrapping procedure. The file that is downloaded is a CSV, whose header is as follows:
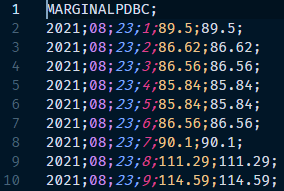
By analyzing the contents of the file, we begin to understand the “complexity” that can be triggered by working with external data sources. In this case, the CSV file does not have any header with the column names, so we must “guess” them. In our case, the column delimiter is the semicolon, and the order of the columns could be: year; month; day; time; value1; value2.
We have no reference to the value associated with the last two columns of the dataset, but at least in the sample data, the content of column value1 is identical to value2, so we can deduce that it is the matching price. But there is always a level of uncertainty as there is no data dictionary or any other way to corroborate this hypothesis, which decreases the quality of the extracted data, and makes it advisable to look for another more reliable data source.
Weather data seems to affect both the supply curve and the demand curve, so it would be reasonable that it should be one of the first sources of data to be used. In this case, there are many services, both public and private, that allow obtaining meteorological information, both at historical (past) and future (forecasts) levels.
VisualCrossing provides weather information via a REST API. Using a REST API for data collection offers several advantages:
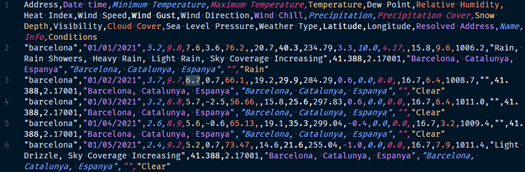
In the information extract above, we can see how the first line of the API response corresponds to what is called “CSV header” where the content of the information contained in each of the data columns is specified.
REE is the agent that operates the Spanish electricity system. Fortunately, it has a public API that does not require any authentication. In this case, the data returned by the API is in JSON format.
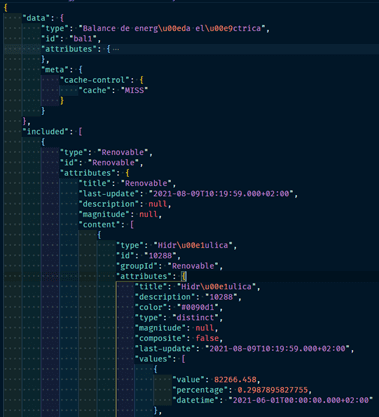
A priori, these data may be more complex to process, but, on the other hand, because they allow the information to be organized in a non-linear way, the expressiveness of the data is increased. In contrast to OMIE, REE offers documentation that facilitates the exploitation and increases the quality of the data.
Within the raw materials used for energy purposes, we will focus on the case of gas. MIBGAS (Iberian Gas Market) is the body that regulates the gas purchase/sale market and publishes a daily reference price. The current year’s indexes are published in an Excel file, which can be downloaded from the website.
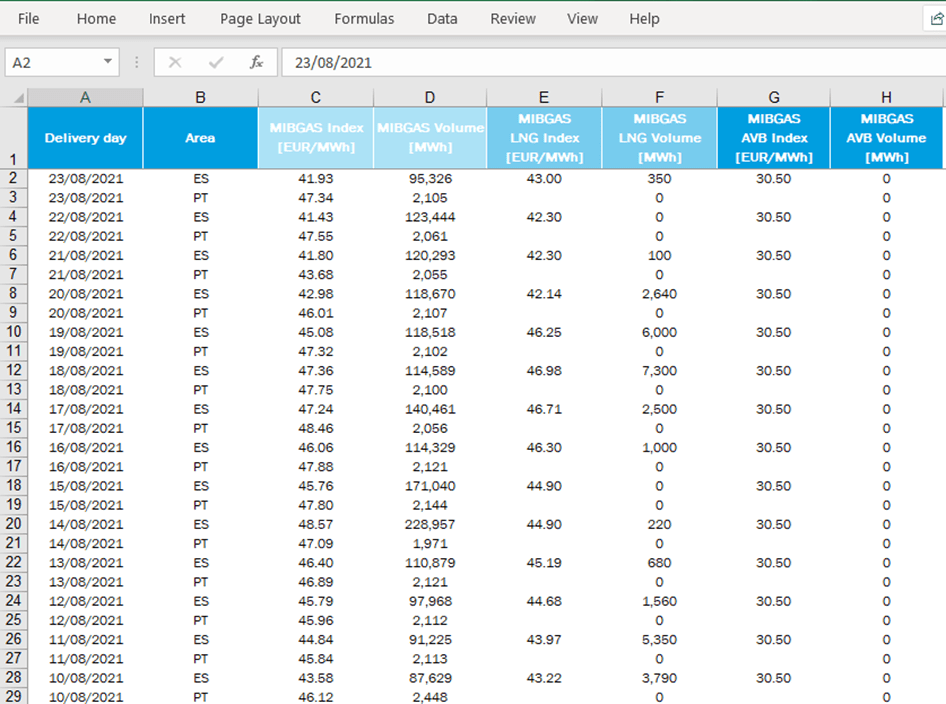
Excel is a format used extensively by people without programming skills, but it can also be used programmatically to access its contents for easy manipulation.
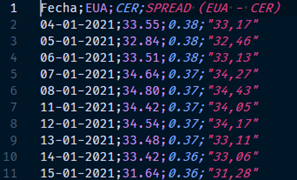
Alternatively, another interesting data associated with the gas price is the price of CO2 emission allowances. In this case, Sendeco2 provides a history (from 2008 to the current year) of emission allowance prices.
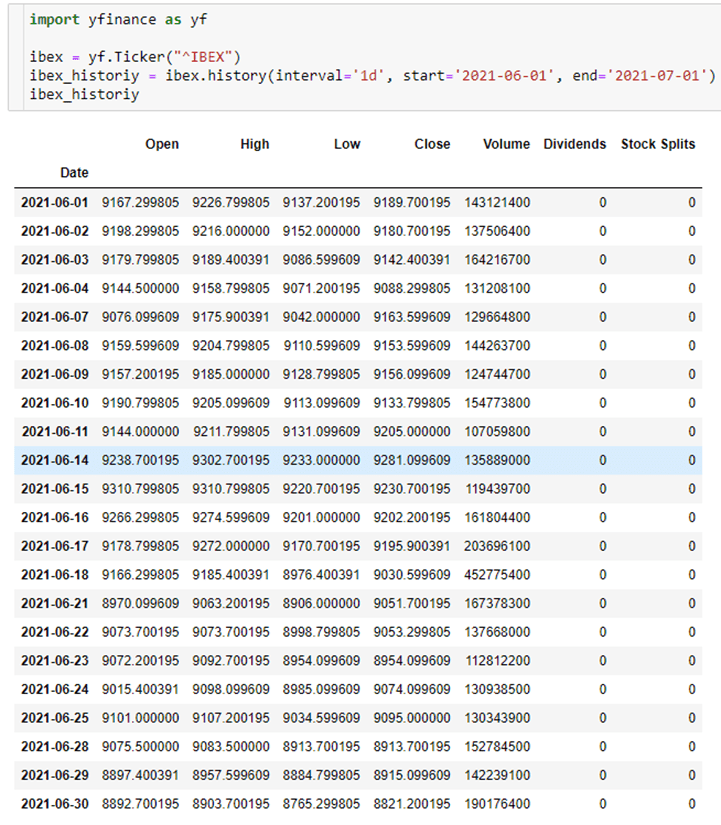
As an indicator of the country’s economic level, we can use the IBEX35 index. This index is freely available on Yahoo Finance. In this case, instead of using the API directly, we are going to use an open-source library (yfinance), which will help to reduce our own development time. In the following screenshot, you can see how easy it is to obtain the IBEX35 indexes, being also possible to apply default filters at source (start date, end date, aggregation interval).
 Activity Data Indicators
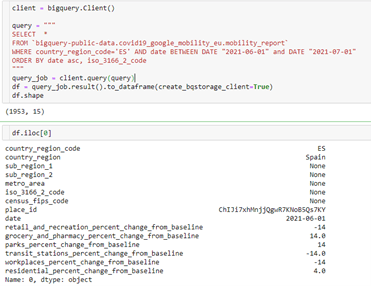
The dataset called “COVID-19 Community Mobility Report” is a dataset developed by Google, in which activity (leisure/recreation, food/pharmacies, parks, transport stations, office areas, residential areas) in different geographical sectors can be observed. Unlike other data sources, this dataset started to be collected in 2020 and is linked to Google’s interests, so its continuity in the future may be compromised.
The information in this dataset is stored in a BigQuery system, which is freely and publicly available. This is another case of using an existing Python library that greatly facilitates data querying.
This way of working with the data has the following advantages:
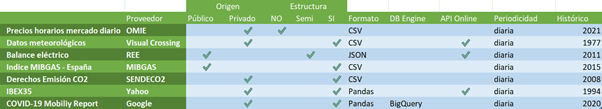
The following table summarizes different factors when considering data extraction from external data sources. These factors may be relevant when estimating the complexity of implementing an extract, transform and load (ETL) procedure.
In the analysis and experimentation phase, it is not so important to automate the process as to be able to extract the data in order to evaluate its suitability for the use case. The next steps should be aimed at the construction of a Data Lake in which the data from the different sources are stored, as well as pipelines that make possible both their ingestion (regardless of the origin) and their subsequent transformation.
This Data Lake would be the basis for the subsequent construction of a Feature Store that would finally feed the training process of the Machine Learning model.
It will always be advisable to use data sources that allow the data to be obtained in the format most similar to the format used by the analysis tools. So, for example, if the data is in a web page, we will first have to build a tool to read the information from a web page (HTML format) and convert it to a table type structure (composed of rows and columns), so that this type of data can be consumed by libraries such as Pandas.
On the other hand, it is much more efficient if we use for example a library like bigquery, which allows us to perform complex queries and return a dataframe type data. However, it is not surprising that most data sources are usually at an intermediate point of maturity between the two examples above.
In this article we have reviewed different factors to take into account when exploiting external data sources:
Elena Canorea
Communications Lead
